
About FoodWorks | Features | What's New | Nutrient List | Technical Specs | Pricing | Upgrades | Ordering
FAQs | How does FoodWorks work? | Sample Reports
The GRAPHICS printout...
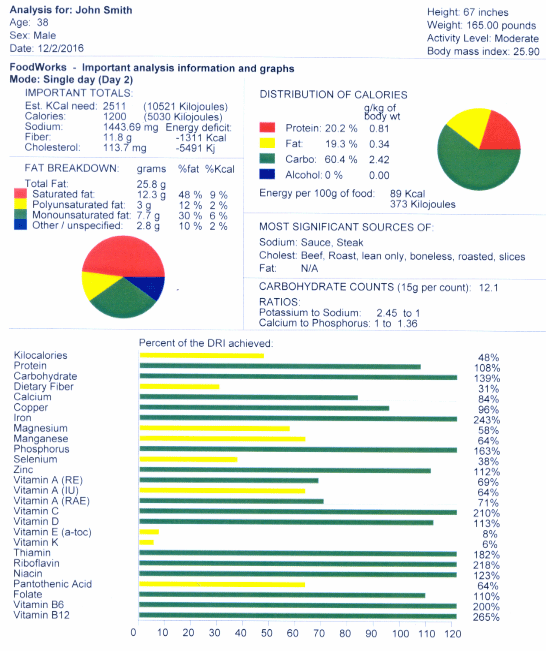
The GRAPHICS printout presents analysis results in pie chart and bar chart form. Distribution of calories and breakdown of fats are shown as pie charts, while the comparison to the selected dietary standard is shown as a bar chart. Other information includes sources and totals for key nutrients, calorie intake and expenditure, ratios, and carbohydrate counts. This printout can be generated for any type of analysis including recipes. This information also is found in the on-screen analysis results displays.

FoodWorks produces many useful printed reports. All printouts include the Information Header, which contains the personal data and date of analysis. For recipes, the name of the recipe is shown along with the date. The personal data in the header can be turned off. These images are actual scans of reports generated in sample analyses. Information on the reports changes depending on selections you make and the type of analysis you perform. Some reports are generated in color. If a monochrome printer is used, the printouts are generated in grayscale. Almost all information on printed reports can be viewed on-screen. Please note that these samples are presented in screen resolution. The actual resolution and color you will obtain will be at the maximum level allowed by your printer.